


The more you know about your customer, the better the targeting, the more efficient and effective your marketing campaigns will be. Your Segmentation, Targeting and Positioning (STP) acts as the core of your Marketing Strategy and forms the basis for all your tactical marketing activities.
Segmentation starts with selecting the most valuable market segments for your business and quantifying the potential size, growth rates and profitability for each of those segments. Along with articulating the size of the segment via TAM analysis, additional tools such as the JTBD (Jobs To Be Done) Framework and Customer Development have proven to be invaluable in unearthing latent customer segments and identifying untapped market opportunities.

Targeting everyone will leave you selling to no one. The more relevant you can be to a specific target audience, the more your product or service will resonate within that group and therefore the greater propensity that group will have to purchase.

Defining your customer persona is an excellent vehicle to provide you with crystal clarity as to who your target customer is. Not having such visibility, will waste time, money, your resources and weaken your brand equity over the long-term.
Product positioning is not about a clever tagline or a brand vision. It represents a clearly defined competitive position, in a chosen segment. Positioning defines how your product is the best in the world at providing something that your ideal customers care about. Think of Positioning as context setting, or how your product is perceived in the mind of the customer.


To arrive at your Product’s Positioning, we will address the 5 key Positioning elements: Competitive Alternatives, Key Unique Product Attributes, Values & Value Delivered, Core Consumer Target & their Values, and the Context your Product Operates within.
Your Value Proposition outlines the benefits your customers can expect from your products and services. The ideal goal is to create value propositions for consumers that tackle important jobs, relieve primary pains, and generate desired gains. Achieving this fit is the main driver of value proposition design and is executed through three distinct stages:


Pioneered by Tony Ulwick of Strategyn, JTBD (Jobs To Be Done) is predicated on the notion that people buy products and services to get a “job” done. As Theodore Levitt astutely stated, “people don’t want a quarter inch drill, they want a quarter inch hole.” By studying the “underlying process” that people are trying to achieve, it becomes possible to capture, quantify and use a new type of customer input that leads to predictable innovation. The metrics people use to measure the successful execution of the “job” forms the foundation of the process.
The unit of analysis is no longer the customer or the product, it’s the core functional “job” the customer is trying to get done. This “job” remains stable over time and provides companies with unique, robust targets for value creation. Ultimately, JTBD offers a new framework and lens through which a company can take its understanding of customer needs to the next level. With the process enjoying success rates of up to 86%, (which is a far cry from traditional methods yielding just 17%) JTBD is fast-gaining traction as a predictable and innovative Value Proposition design tool among Silicon Valley Start-Ups and large innovative tech-companies alike.
Nothing impacts your bottom line more than an improvement in your pricing. A 1% increase in pricing affects a company’s profits more than any other change (McKinsey & A.T. Kearney). Therefore, it is mission critical to get your pricing spot-on.
Compared to the other 2 P’s (Product & Promotion), a pricing strategy is about a company’s long-term sustainability. It aligns with the other P’s to create a viable, value proposition for the customer and it transmits the most important signal to the customer – what the product/service is actually worth.

In the digital landscape, the business model and the pricing page become the most important touch points and are an integral part of the tactics that make up the overall pricing strategy. It is a vital component of the Marketing Strategy that is seldom evaluated but can yield the best return.
Value-based pricing is a strategy of setting prices primarily based on a consumer's perceived value of a product or service. Value pricing is customer-focused pricing, meaning companies base their pricing on how much the customer believes a product is worth. Studies show that most customers have a poor idea of what an item should cost. Instead they decide (mostly with emotions rather than logic) what a product is worth. To maximize profits, therefore, price the value, not the service.
This can be achieved by leveraging the 5 Cs of Value.

For both tech start-up and established companies, monetising your digital innovations with ineffective pricing could eventually bankrupt your operations. To avoid such pitfalls, Simon-Kucher & Partners (35 Yrs. Exp monetising innovation) has identified 9 pricing traps to avoid, including:

Brands have emerged as strategic tools that can be leveraged to facilitate both purchase and retention of your products and services and are therefore a key tool in marketing strategy.
Products may be created in the factory, but brands are created in the mind. They are the additional dimensions that differentiate your product from other products – The brand image, also known as brand equity, is used to build added value over and above the generic product offering. Together with clear positioning, brand building strengthens the emotional attachment to your brand and fosters purchase loyalty. This is underpinned by developing and reinforcing a relevant set of brand values which are consistent with your target audience.
DavinDigital’s brand management capabilities can help you define your brand’s positioning, core values, and help create an iconic brand identity. In addition, DavinDigital can undertake brand audits and review or realign your existing brand architecture and develop new brand extensions.
Marketing is responsible for delivering a revenue line within an acceptable cost per acquisition and retention. Marketing campaigns should deliver a demonstrable ROAS (return on ad spend) and should be tracked over the full period of their lifetime value. For Digital Business, the unit economics are key: LTV to CAC (Lifetime Value to Customer Acquisition Cost). Working to a rule of thumb this should hold to a ratio of 3:1.

The marketing strategy defines marketing budget allocation which should be tied to the company’s revenue model. For transparency, a marketing budget should be delineated among acquisition, retention, marketing tech, market research and facilities. The goal of an efficient marketing budget is to maximise revenue generation and minimise cost per acquisition and retention.

The best marketing team structure is the one that is most agile. To be effective in fast paced digital environments, marketing teams need to move away from conventional, hierarchical structures and empower teams to be more autonomous. This means that team members cannot wait for managers to make top-down decisions that trickle through the organization. To keep pace, teams must be able to make decisions on-the-fly and work in the way that suits them to achieve their goals.
The most effective, agile, marketing team structure for your organization will depend on your industry, target customer profile and chosen media mix. Depending on the context and goals of the marketing plan, the outsourcing of suppliers to in-house delivery ratio will vary, with the former enabling agility and the latter reducing overall cost.
However a third structure does exist. DavinDigital has set-up globally distributed, international marketing teams for the entire marketing function. Securing world-class, industry and channel specific expertise, while maintaining operational flexibility, we connect you directly to the specialists, so you can obtain top-level services at a fraction of typical agency fees. Operational complexities are resolved by defining clear roles, duties, and responsibilities, (OKRs & DRIs).
Mercenaries deliver whatever they're told to deliver. Missionaries are true believers in the vision and are committed to solving problems and delivering for their customers.
Coaching is at the heart of developing Missionaries and ultimately turns ordinary people in to extraordinary digital teams. Digital is a team sport, and the most important responsibility of a people manager is to develop the skills of their people. This means empowering your team to own outcomes and not just the task list. It means creating the space and culture, stepping in to remove impediments, clarifying context and connecting the dots, as well as providing real-time guidance. The ideal Digital Team is a team of Missionaries. which DavinDigital can help you to build and coach.


Marketing has shifted from faith-based to fact-based. Metrics and data should be driving all your marketing decisions. Analytics tracks the metrics that are crucial to growing your business and for validating marketing campaign success.
An excellent framework to adhere to is The Pirate Metrics Model or AARRR. It is a 5-step model for creating a metrics framework, created by Silicon Valley, 500 Start-Ups Founder Dave McClure. It is just as relevant today, as when it was developed in 2007. However, depending on your business and where you are in the product cycle, the order may differ. Another useful tool is a prominently displayed (large, wall-mounted, flatscreen TV), marketing dashboard, updated daily, tracking all the relevant KPIs & revenues - a real, must-have for all marketing teams operating in the digital realm.

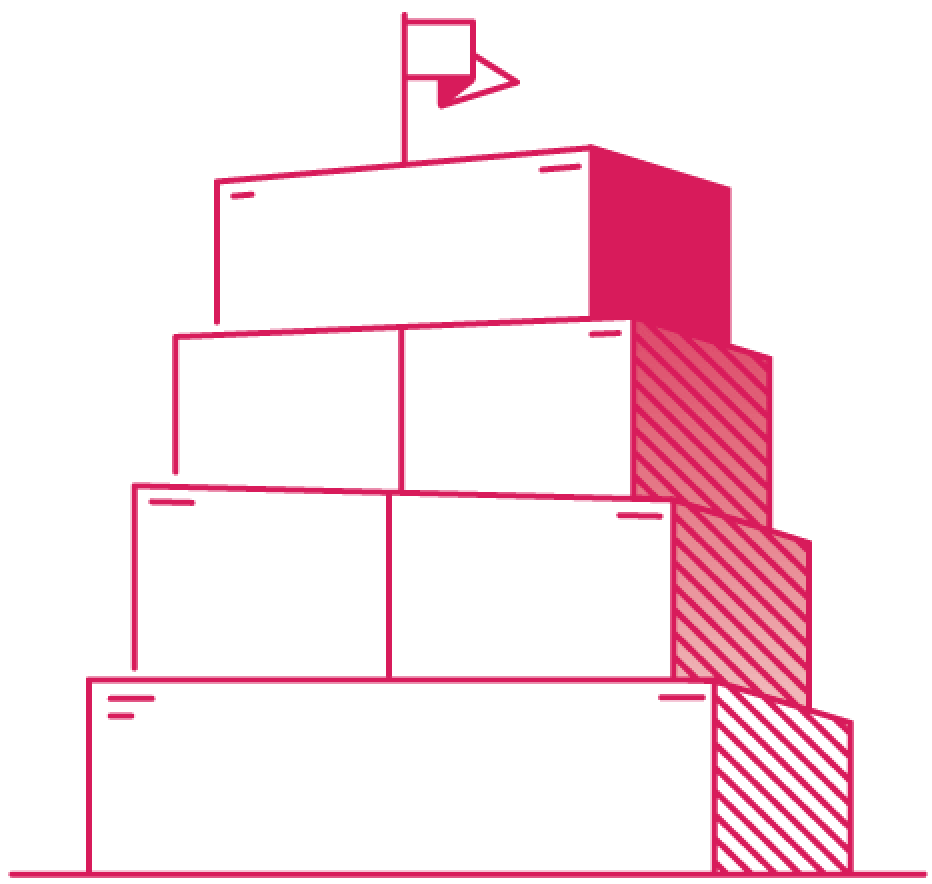
A good place to start is to identify and track the 8 to 10 macro-metrics that will move the needle in your business, as well as have an overarching focus on a “North Star” metric - the one measurement that is most predictive of your company's long-term success.